Account Spark
A rep opens Monday with a hundred accounts and no idea which one to work on. This is the product that answers that — and the client liked it enough to rebuild their original to match.
An enterprise revenue-intelligence platform · client under NDA
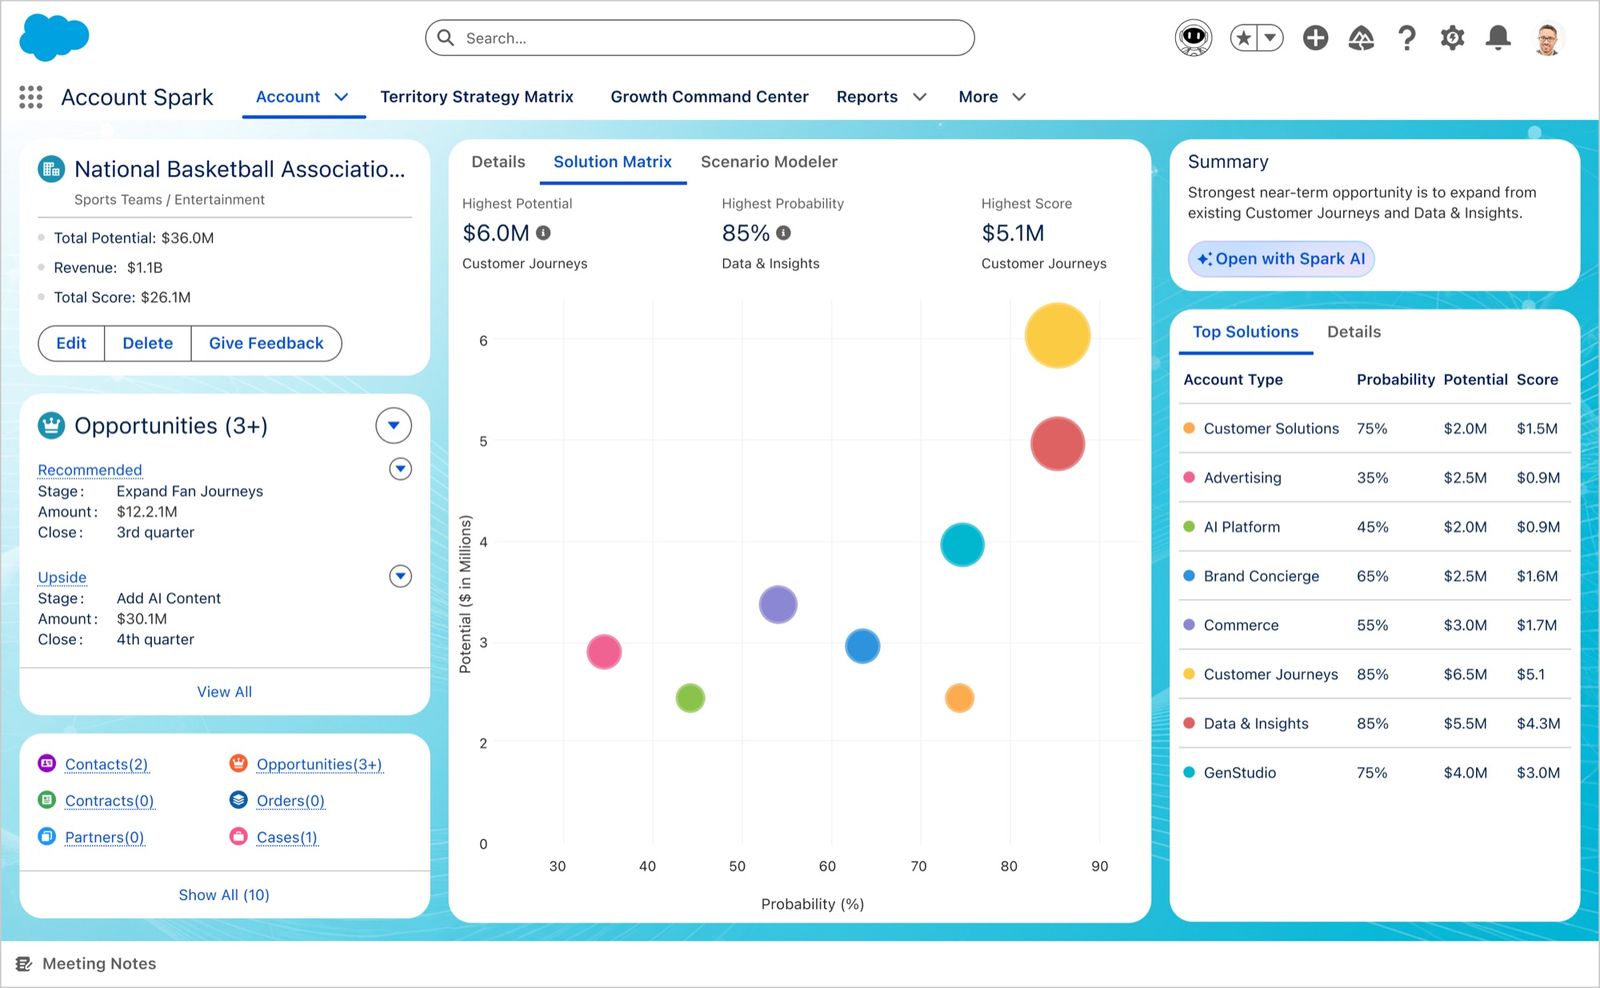
The account page. Everything a rep needs about one customer — what they own, what's open, what to sell next — on a single screen inside Salesforce.
A hundred accounts. Which one?
Monday morning, a rep with a hundred enterprise accounts opens the tool meant to tell them where to spend the week.
What loads is a wide grid — ranking, emails, meetings, potential, revenue, pipeline, gap — fed by six data sources. Every fact is on screen, and the rep still has to work out who to call first.
Stop answering “what is the state of my accounts?” Start answering “what should I do today, and why?”
Two people and one test
No design team on this — me and the product owner. He held the vision and brought feedback from real reps; I proposed the structure. Nothing got built until we'd argued it through.
Every idea was measured against one question: does this help the rep decide what to do in the next hour? Anything that only described a state moved to a secondary view. That test killed a few of my own ideas.
What we turned down mattered as much:
- Replacing the data grid entirely. Cleaner, and it removes the tool experienced reps had built their routine around. A screen that deletes someone's main tool doesn't get adopted — it gets worked around.
- A confidence score on each recommendation. Tidier than a sentence, and it explains nothing. “87% priority” raises the exact question it's meant to answer.
- A floating AI assistant. More noticeable, and it makes the AI the subject of the page instead of a tool serving the record underneath.
- Editing real data inline. Faster to build, and it would quietly corrupt records other teams depend on.
Four questions, in the order a rep asks them
Which of my hundred accounts deserve this week?
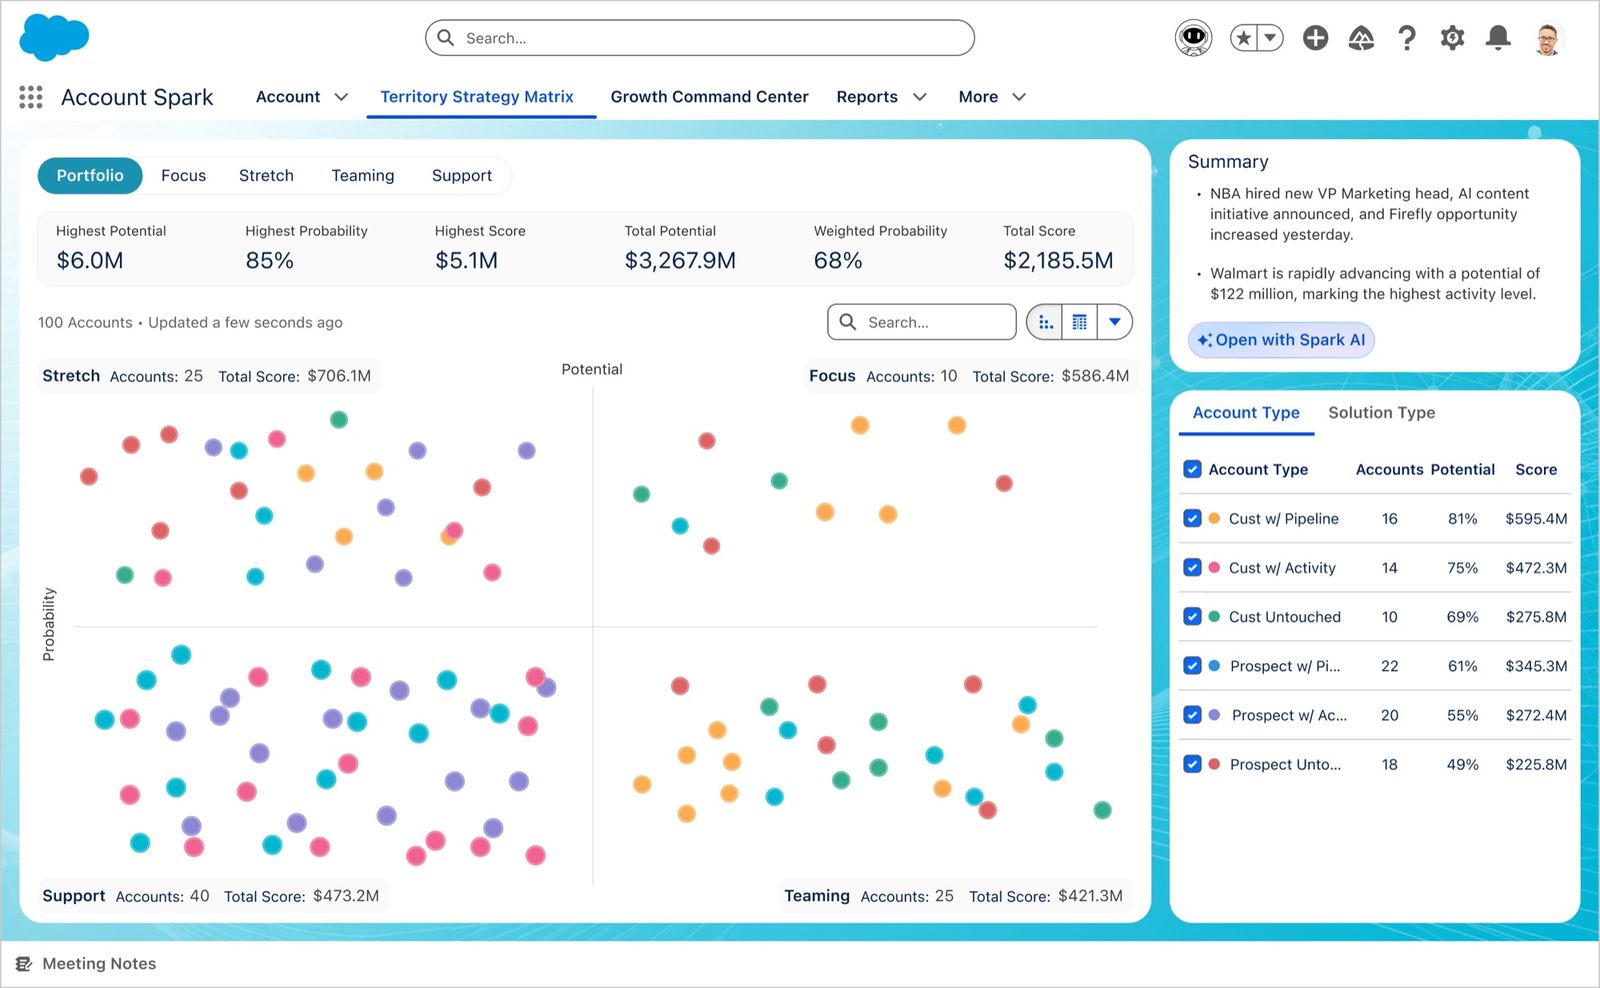
Accounts are plotted on potential against probability, in four quadrants. The colour isn't the point: each carries a total score beside its account count, and maps to a named way of selling — direct attention, executive support, coordinated outreach, low-touch nurture. The question changes to “is this group worth my week?”
Inside this account, what do I actually sell?
Opportunities are scored and plotted as a bubble chart: position carries the priority dimensions, size carries the score. The biggest registers before you read a number, with the ranked list beside it for detail.
What path gets us from here to there?
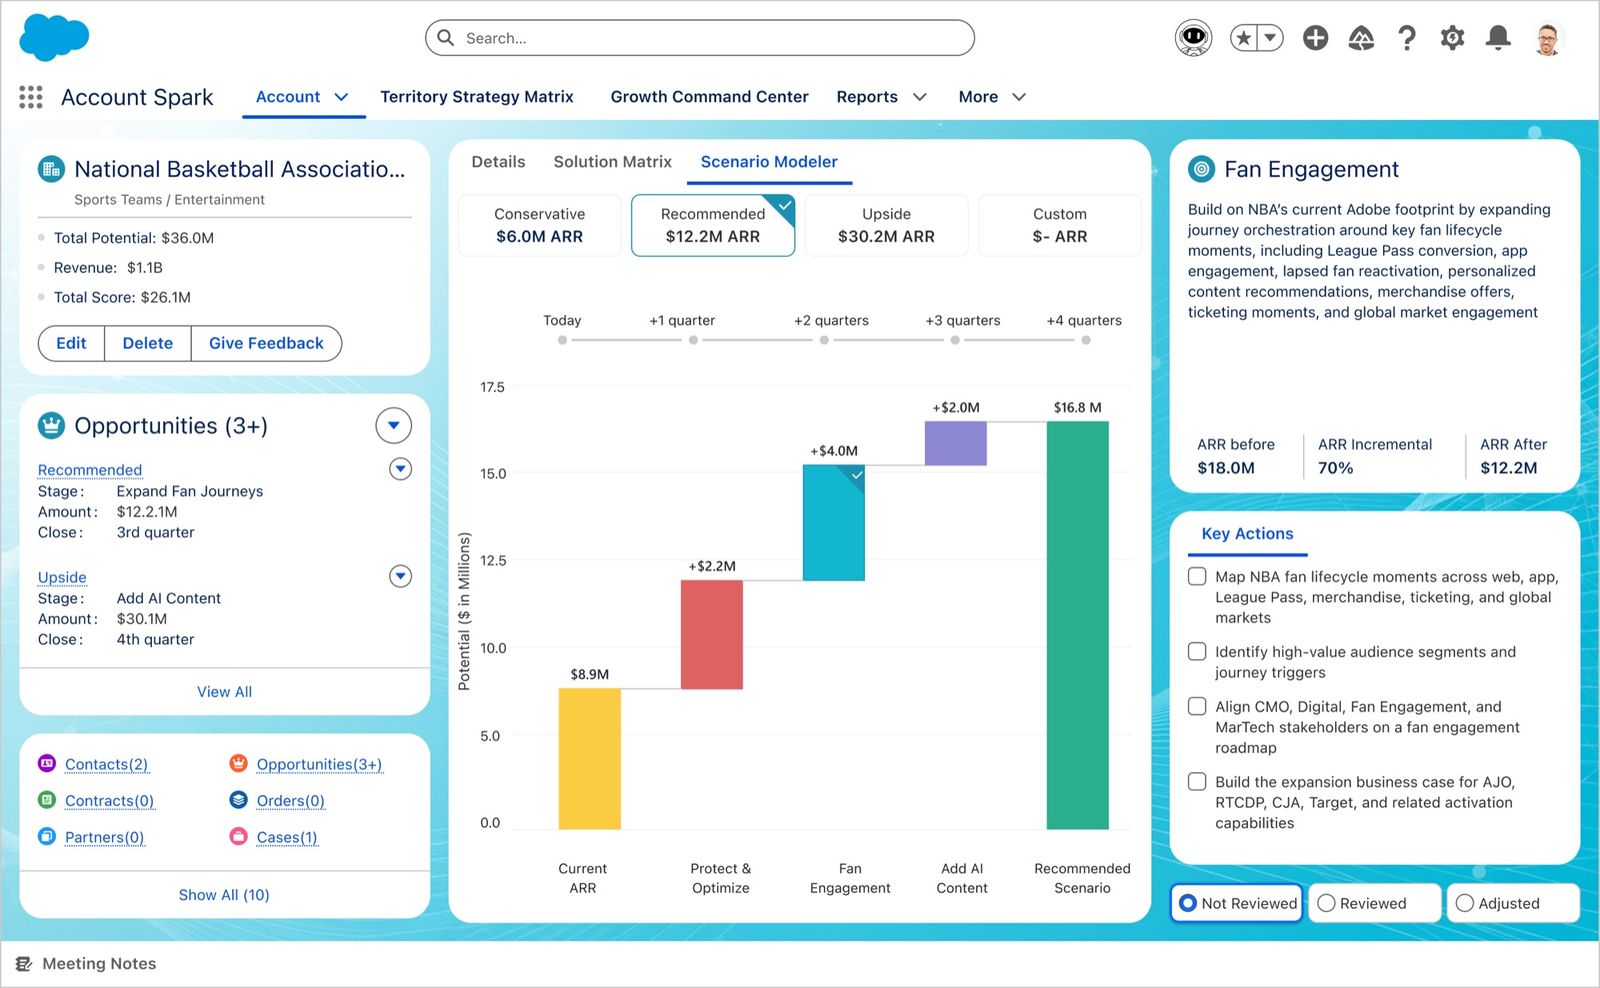
Four growth scenarios: conservative, recommended, upside, or build your own. Picking one charts today's revenue to a modelled total, every increment attributable to a specific initiative — so the rep can defend the number, because they can see where each piece came from.
So what do I do on Monday?
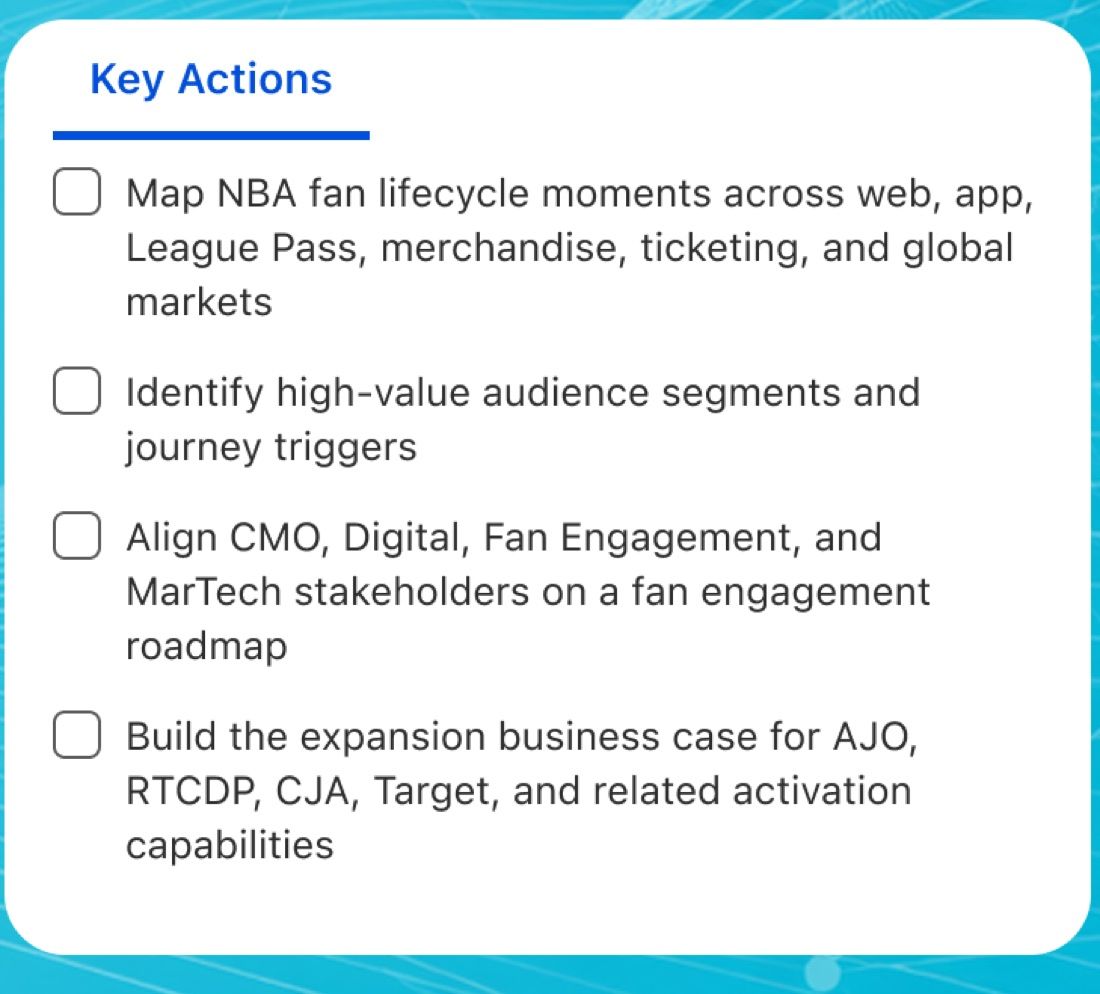
Every scenario ends in a checklist, not a number: map the lifecycle moments, identify the segments, align the stakeholders, build the business case. The difference between a model and a plan.
And if I want to ask rather than read?
Spark docks beside the record rather than floating over it, and changes job with the screen — account strategist here, territory coach on the matrix, execution coach on the dashboard. It opens with questions specific to what you're looking at, not an empty box, and any number can be clicked to ask why it says what it does.
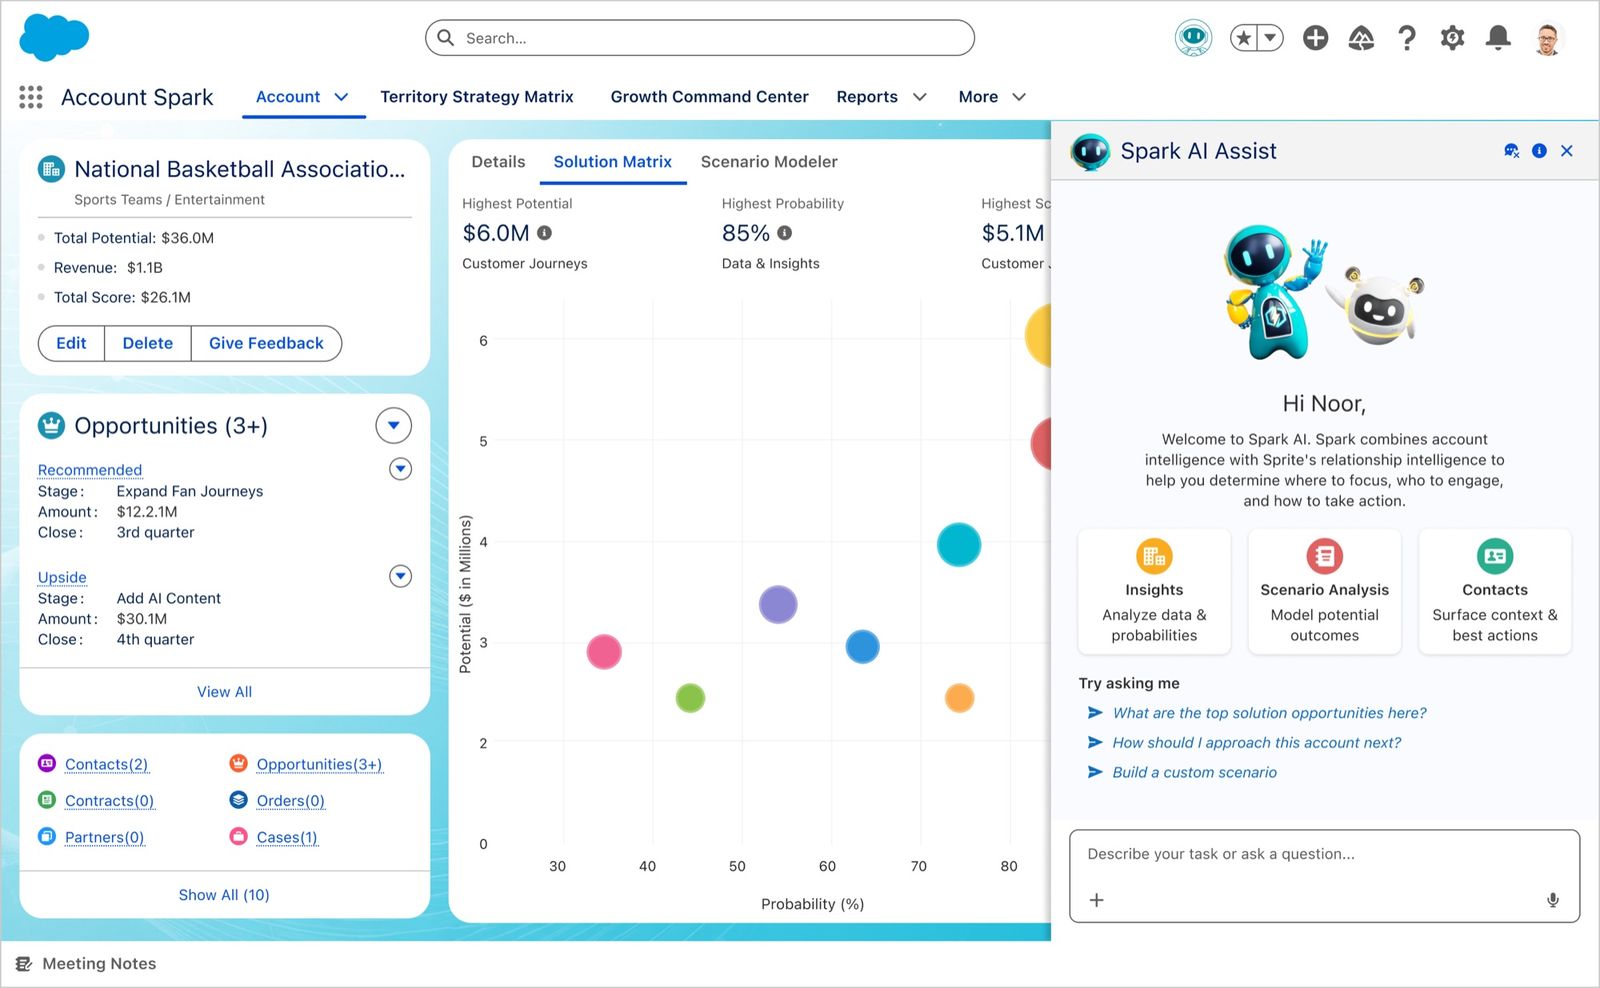
I designed the assistant for one AI. There were two.
I built the assist panel assuming one voice behind it: Spark, reading the account maths — potential, probability, score, gap.
Partway in I found out there's a second. Sprite handles relationships — who knows whom, which contacts are worth a call. A useful answer needs both, and I'd designed a panel that could speak as only one.
The question stopped being what should this say and became whose answer is this. Attribution became part of the interface.
They replaced their own product with it
The client already had this live in Salesforce. An acquisition meant they needed a Microsoft Dynamics 365 version — a port, on paper. I didn't treat it as one. The rebuild fixed what the original couldn't do: quadrants got a score and a sales motion, the “playbook” became traceable scenario stages, modelling was split from real data.
Two weeks after it closed they came back: bring the original Salesforce product up to the standard of the Dynamics rebuild. Same product, second platform, this time to replace what they already had.
“We need this immediately.”
It hasn't reached reps yet, so there are no usage numbers and I won't estimate any; every name and figure here is sample data. The evidence that holds up is the engagement: same client, same product, hired twice.
This one's under a confidentiality agreement, so the full walkthrough isn't public. Happy to take you through it directly.